Pipeline Modeling Language
Introduction
Diagrams are a good help when designing, describing or explaining how systems work. In order to help with the design and explanation of data pipelines (on AWS) we created a modelling language. The models capture data pipelines, their components and inter-connections
The visual language is “white board proof” meaning that it can easily be drawn on a whiteboard but it is also made suitable to use basic tools like keynote and powerpoint, or slightly more advanced modelling tools like omnigraffle and Visio.
The models gradually stiffens during a design. You can design your high level pipeline using only a couple of simple symbols and dive into more details of your architecture later by the basic shapes. We hope this helps you keep your focus at the right abstraction level.
What is a pipeline
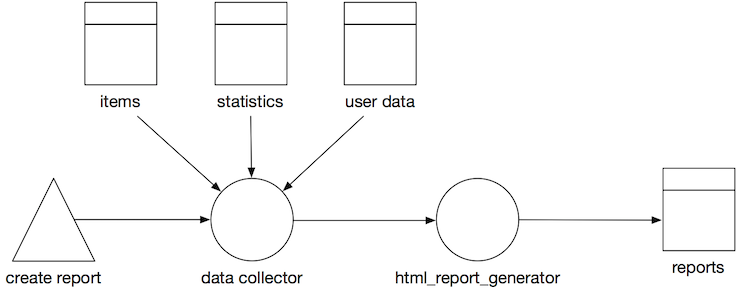
A pipeline is any path that manipulates and stores data. It starts at a trigger or event, data gets processed and ends in a data store. Often you can spot pipelines by following the code path arrows that connects 2 datastore. A pipeline can consist of many other pipelines. In general we would say: if you can slap a name on a process between 2 datastores, it probably is, or should become a pipeline.
Creating Pipeline Models
We created a set of figures to use when modelling your data pipelines with draw.io.
In order to use the figures in draw.io follow the following steps:
- Go to draw.io and create a new diagram.
- From the menu bar, select
File>Open Library from>URL. - Enter the following URL
https://raw.githubusercontent.com/Sparkboxx/pipeline-modelling/master/attachments/Data%20Pipeline.xml.
The shapes library on the left should now contain a section called Data Pipeline.
Basic Shapes
There are a few basic shapes: circles, double-squares, triangles, arrows and rectangles. If you can draw these shapes you can model data pipelines on a whiteboard or cobble sketches together in a tool like powerpoint or keynote.
| Shape | Image | Description |
|---|---|---|
| Processor |  | Circle with an optional type indication inside. Name Required. A processor is a component that takes takes input data, processes it and writes its output. This normally means a processor transforms the input data into something new. A processor can be “always on”, or can be triggered by an event or manual action. A processor can take its input and send its output anywhere: a data store, a queue, a stream or another processor. Likewise for its output. |
| Data Store | 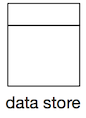 | Square with a rectangular bar on top. the main square can contain a type indication. Name required. A data store is a persistent or temporary datastore of any type. The definition is quite liberal. S3 is seen as a key value store and uses the same symbol as a.o DynamoDB and Postgresql. |
| Trigger |  | Triangle with a possible type indication inside. Name Optional. A trigger is a process that kicks of a pipeline. |
| Flow | 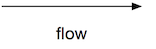 | Arrow with at least 1 arrow head that indicates the flow of data. Name optional. Flow is the connection between processors, storage and triggers. Flow comes in different types: synchronous, asynchronous, queued and streaming. |
| Other | 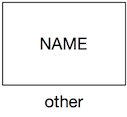 | Rectangle, no fill, identifier inside. Name optional. If it isn’t a processor, a data store or a trigger. It’s probably something else. Represented by a rectangle. There are some variations on the “other” icon, but if it fits, write the name of the system in the rectangle. |
| External | 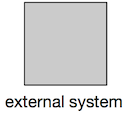 | Rectangle, solid fill. Name required. Sometimes you simply don’t care, do you? When your boundaries are strong it’s often enough to model an external system as a black box. |
Document Source
The source of this documentation can be found in github. This documentation is automatically built into sparkboxx.github.io/pipeline-modelling.